
Forex Trading Strategies and Key Indicators
The Forex market offers traders the chance to create unique strategies based on market trends and movements. With a variety of strategies and tools at their disposal, traders can customize their approach to suit their individual goals, risk tolerance, and experience. In this guide, we’ll explore key trading methodologies, including fundamental and technical analysis, which can help you craft your own approach to the market.
Fundamental vs. Technical Analysis
When it comes to analyzing Forex markets, traders typically fall into one of two categories: those who use fundamental analysis and those who prefer technical analysis. Each approach has its strengths, and often, traders will combine both methods for a well-rounded trading strategy.
1. Fundamental Analysis
Fundamental traders focus on broader economic, political, and global factors that might impact a currency’s value. Key factors include:
- Geopolitics: Political shifts, international conflicts, or trade agreements can all influence currency prices.
- Central Banks: Central banks, like the Federal Reserve, can drive currency values through monetary policies such as interest rate changes.
- Economic Reports: Economic data releases, like GDP growth or inflation figures, can significantly affect market perceptions and currency values. If a report surprises the market, it may lead to a sharp price movement.
2. Technical Analysis
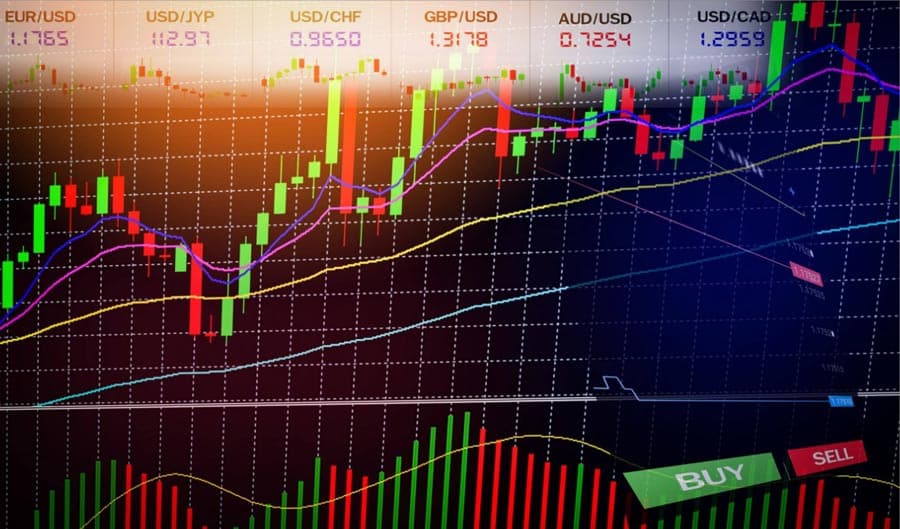
Technical analysis, on the other hand, relies on historical price data and chart indicators to forecast future price movements. Technical traders use patterns, trends, and momentum indicators to assess whether a currency pair is overbought or oversold. Popular chart types include:
- Line Charts
- Bar Charts
- Candlestick Charts
At PFD Markets, you can access a range of charting tools to support your technical analysis. While no single chart type is universally superior, combining technical and fundamental analysis can provide a more comprehensive view of the market.
Forex Trading Approaches and Key Indicators
There are several strategies and indicators that can help traders make informed decisions when trading Forex. Below, we cover some of the most popular approaches:
Position Trading
Position trading is a longer-term strategy where traders hold positions for weeks or even months. Traders typically use fundamental analysis to make decisions and may enter a trade when a currency pair reaches a key support level. Position trading is often less about reacting to short-term price fluctuations and more about capitalizing on broader market trends. Traders who use this strategy are often referred to as ‘trend followers’ because they rely on long-term market momentum.
Key Indicators Used in Forex Trading
1. Simple Moving Average (SMA)
The Simple Moving Average (SMA) is a widely-used technical indicator that helps traders identify the direction of a trend. The SMA calculates the average price over a set period, which smooths out price fluctuations. A rising SMA indicates an upward price trend, while a falling SMA suggests the price is declining. Common periods used for SMA include 50, 100, and 200 days.
2. Exponential Moving Average (EMA)
Unlike the SMA, the Exponential Moving Average (EMA) gives more weight to recent prices, which makes it more responsive to market movements. This helps traders detect price trends more quickly. While EMAs can provide a clearer picture of trends, they are still lagging indicators, meaning they may not react swiftly to sharp price changes.
3. Relative Strength Index (RSI)
The Relative Strength Index (RSI) is another valuable tool for gauging whether an asset is overbought or oversold. The RSI is measured on a scale of 0-100, with readings above 50 often indicating an uptrend, and readings below 50 signaling a downtrend. RSI can be used alongside SMA to confirm potential trends, but it’s important to remember that it’s only a general indicator and should be used in conjunction with other analysis techniques.
4. Bollinger Bands
Bollinger Bands are typically used in combination with the SMA to assess market volatility. These bands consist of an upper, lower, and middle line, with the middle line representing the SMA. When the bands widen, it signals increased volatility, while a contraction suggests more stable market conditions. Bollinger Bands can be a valuable tool for identifying potential price breakouts.
5. Moving Average Convergence Divergence (MACD)
The MACD is a momentum indicator that tracks the relationship between two moving averages. It’s commonly used to identify shifts in market momentum and trend strength. A positive MACD indicates upward momentum, while a negative MACD suggests downward pressure. The MACD is a powerful tool for identifying entry and exit points in Forex trading.
Enhancing Your Trading with Advanced Tools
In addition to these basic strategies and indicators, PFD Markets offers more than 90 advanced technical indicators, along with powerful drawing tools and analytical features that can help you master Forex trading. Whether you’re a beginner or an experienced trader, these tools can assist you in refining your strategy and gaining deeper insights into market behavior.
If you’re ready to practice your trading skills without the risk, sign up for a free demo account today. With unlimited access to real-time charts and all the necessary tools, you can develop your trading strategy at your own pace.
To start exploring these indicators, simply sign up or log in, choose a currency pair, and open its chart. From there, you can click on the (Fx) icon to access all of our advanced trading tools.


